
How to Look Up Sedgwick County Jail Population Data
Population data lives in a few official places rather than in the name-search roster. The Sedgwick County criminal justice population report tracks the jail's annual average daily population over many years. A federal audit, the PREA report, captures a recent 12-month snapshot of the Adult Detention Facility. The Sheriff's Detention Bureau pages give the operating capacity. These sources update on their own schedules, so a yearly report and an audit can show slightly different figures depending on the period each one covers.
To read the data well, note which period a number describes and which facility it covers. A capacity figure is not the same as a daily count, and an adult-jail number is separate from juvenile detention. Mixing a rated bed count with a yearly average, or an adult figure with a juvenile one, is the most common error in reading jail data. For a single person's current custody, the name search is the right tool instead, and the Sedgwick County inmate records page explains it.
Sedgwick County Jail Capacity Overview
Capacity figures vary by source, and the page treats both as valid. The Sheriff's biography describes the office as operating one of the largest county jails in Kansas with a 1,200-bed capacity. The Detention Bureau page states that the Operations Division manages secure housing of up to 1,500 inmates. The PREA audit reported an average daily population of 1,408 over its 12-month window. These figures describe different things, a rated bed count versus an operational housing figure versus a measured average, so they should be read together rather than as a single fixed number.
| Facility | Address | Capacity / Population |
|---|---|---|
| Adult Detention Facility | 141 W Elm, Wichita | 1,200-bed capacity; up to 1,500 housed; PREA ADP 1,408 |
| Juvenile Detention Facility | Juvenile services campus, Wichita | 108-bed; 2023 ADP 38; about 470 admissions a year |
| Juvenile Residential Facility | 881 S Minnesota, Wichita | 16-bed licensed non-secure facility |
The difference between a rated capacity and an operational figure is worth a moment. A rated bed count reflects the number of beds the facility is designed and approved to hold. An operational figure can run higher when the agency uses flexible housing to manage demand. When a recent average sits between the two, as it does here, the jail is operating in a tight band where classification and release timing carry real weight in day-to-day management.
Average Daily Population Over Time
The county's population report tracks the adult jail's annual average daily population back to 2007. The trend tells a clear story. Counts ran above 1,500 in the late 2000s, drifted down through the 2010s, then fell sharply around 2020 and 2021, a pattern seen in many jurisdictions during that period. The number then climbed again in the most recent years. A few representative values from the report are shown below.
| Year | Average Daily Population |
|---|---|
| 2008 | 1,650 |
| 2014 | 1,502 |
| 2019 | 1,500 |
| 2021 | 1,188 |
| 2022 | 1,137 |
| 2024 | 1,407 |
Read the trend as a curve, not a set of isolated points. The decade from 2008 to 2019 saw a slow decline from the high 1,600s toward roughly 1,500. The years 2020 through 2023 dropped well below that band, reaching the low 1,100s. The most recent figures climb back toward 1,400, which is close to the facility's recent measured average. A single year can move for many reasons, so the multi-year shape tells more than any one number.
Note: Chart labels in the source report should be read carefully, since the most recent years sit close together near 1,400 to 1,440.
PREA Audit Data for the Adult Facility
The PREA audit gives a useful fielded snapshot of the Adult Detention Facility. Over its 12-month period, the report listed an average daily population of 1,408 and an age range of 17 to 66. It described custody levels of minimum, medium, and maximum. It also recorded 22,502 admissions and an average length of stay of 23 days. Those last two numbers explain why the jail is busy even when the daily count looks moderate. A high admission count with a short average stay means a large flow of people moving through the facility each year.
This flow matters for records requests too. With more than 22,000 admissions a year, many bookings are short, so a person can be booked and released before a roster check catches them. That is one more reason the current-custody search and a phone call work together. The PREA audit exists to measure sexual-safety standards in custody, but its summary fields double as a clean population snapshot, which is why it is cited here. Because the audit covers a set 12-month window, its 1,408 figure is a measured average for that period rather than a live count on any single day.
Capacity vs Population
Comparing the figures side by side shows the pressure on the system. The recent average daily population of 1,408 sits above the 1,200-bed capacity cited in the Sheriff's biography and below the up-to-1,500 operational figure from the Detention Bureau. That gap is exactly why the page presents all three numbers. A jail running near or above its rated bed count manages crowding through housing decisions, classification, and release timing.
| Measure | Figure | Source |
|---|---|---|
| Rated capacity | 1,200 beds | Sheriff biography |
| Operational housing | Up to 1,500 inmates | Detention Bureau page |
| Recent average | 1,408 ADP | PREA audit |
Demographic and Custody Breakdown
Official material gives a partial demographic picture. The PREA audit's age range of 17 to 66 and its three custody levels of minimum, medium, and maximum are the confirmed fielded details. A full breakdown by race and sex was not published in the sources reviewed, so this page does not estimate those figures. The same is true for a pretrial versus sentenced split and a felony versus misdemeanor split, which were not available in the official material harvested.
Where the page lacks a county number, it says so rather than guessing. National and statewide jail studies from sources such as the Bureau of Justice Statistics offer broad context, but applying a national rate to Sedgwick County without a local figure would mislead. The honest answer is that the confirmed local data covers totals, trends, capacity, age range, and custody levels, and not a detailed demographic table.
For readers who want those finer cuts, the path is an open-records request rather than this page. The county responds to records requests under the Kansas Open Records Act, and a specific, well-framed request to the Sheriff's Office may yield a report that an audit summary leaves out. The public records page explains how to file that kind of request and what the county can and cannot provide.
Juvenile Detention Population
Juvenile detention runs separately from the adult jail and posts its own numbers. The Juvenile Detention Facility holds youth ages 10 to 17 who are awaiting hearings, placement, or sanctions, with a 108-bed capacity. Its 2023 average daily population was about 38, with roughly 470 admissions a year and an average stay near 35 days. A smaller Juvenile Residential Facility at 881 S Minnesota is a 16-bed licensed non-secure site for youth who need services short of secure confinement.
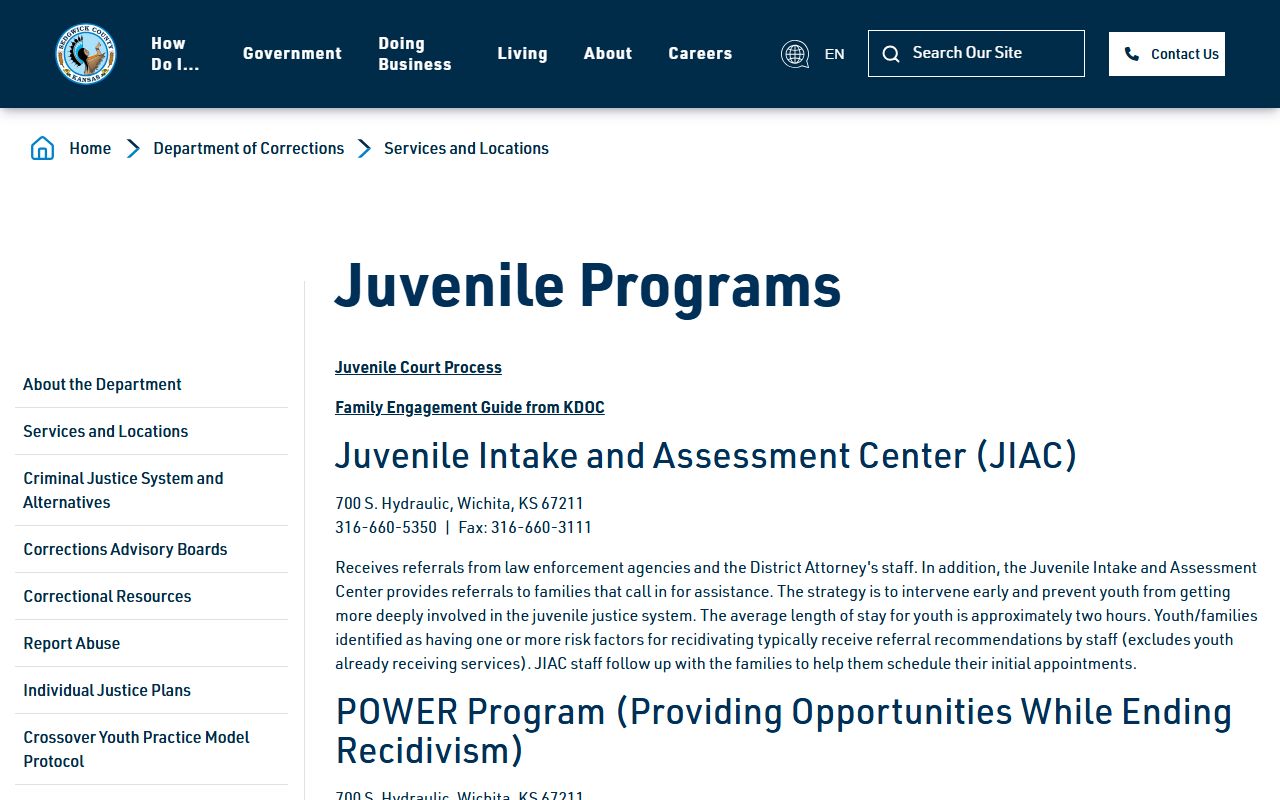
The county's juvenile services page is shown below from Sedgwick County.
Juvenile records are heavily restricted, so this section deals only with published population figures.
What Drives the Population Trend
A jail population is not a fixed number; it is the result of arrests, charging decisions, bond, court speed, and release timing all working at once. Sedgwick County is the busiest trial district in the state, and the District Court reports heavy caseloads, with roughly 3,000 criminal cases and about 20,000 traffic citations a year. Each new case can add to the jail count when a defendant is held, and each disposition or bond can lower it. The sharp drop around 2020 and 2021 lined up with court slowdowns and policy changes seen across the country, while the rebound since then tracks a return to fuller court operations.
The short average stay of 23 days, paired with more than 22,000 admissions a year, shows a system built around rapid turnover rather than long holds. Most people booked into the Adult Detention Facility do not stay long, which keeps the daily average well below the total number of people who pass through. To see how charges become cases, the arrest records page covers booking and the court process, and the court records page covers the case files those bookings produce.
Where the Population Data Comes From
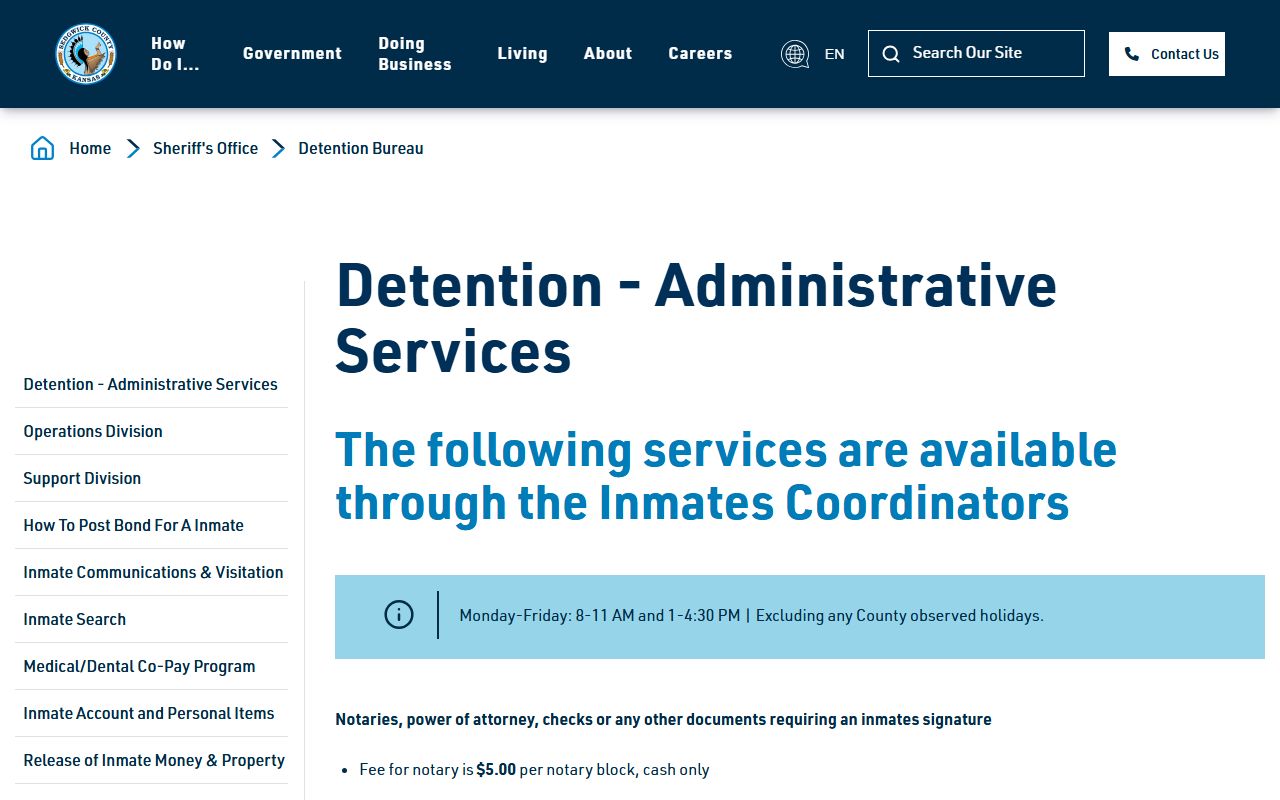
Knowing the source helps you weigh each number. The annual figures come from the county's criminal justice population report, the snapshot fields come from the PREA audit, and the capacity statements come from the Sheriff's Detention Bureau and the Sheriff's biography. Administrative services at the jail also handle data and records functions behind these reports. The detention administrative services page is shown here from Sedgwick County.
Because each source updates on its own schedule, always check the report date before quoting a figure. A capacity statement may stand for years while a population report changes annually and an audit covers a single window, so two correct numbers can still disagree simply because they describe different moments.
Searching for an Inmate by Name
This page covers totals and trends, not individuals. To look up a specific person, use the Sheriff's current-custody name search rather than the population reports. That search returns who is held now, while the population data answers how many and over what period. The Sedgwick County inmate records page walks through the name search, and the released inmates page covers verifying a release.